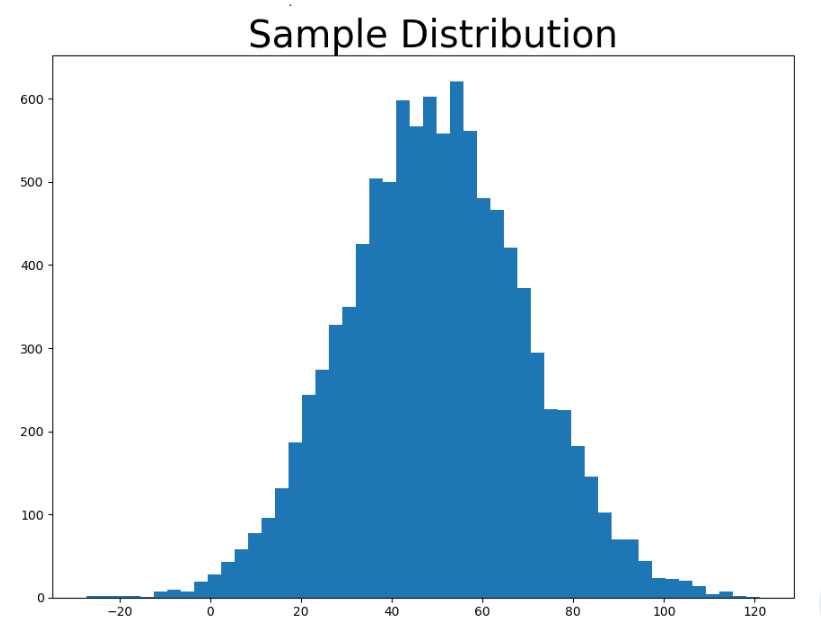
The image below was created using Matplotlib. It is a distribution plot of a list of integers filled with numbers using the function _ and plotted with _.
The image below was created using Matplotlib. It is a distribution plot of a list of integers filled with numbers using the function _ and plotted with _.