How do you create a heatmap in a table, such as this one, which is responsive to the values?
data bars (within conditional formatting)
manual highlighting
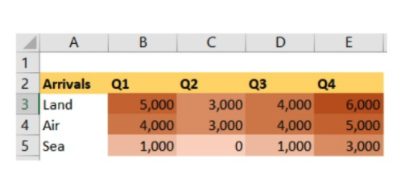
color scales (within conditional formatting)
map chart