The charts below are based on the data in cells A3:G5. The chart on the right was created by copying the one on the left. Which ribbon button was clicked to change the layout of the chart on the right?
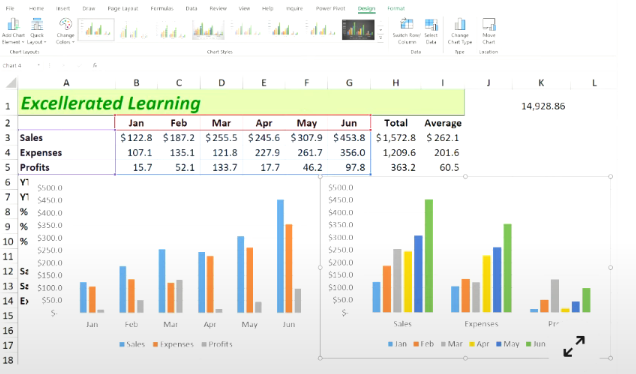
The charts below are based on the data in cells A3:G5. The chart on the right was created by copying the one on the left. Which ribbon button was clicked to change the layout of the chart on the right?