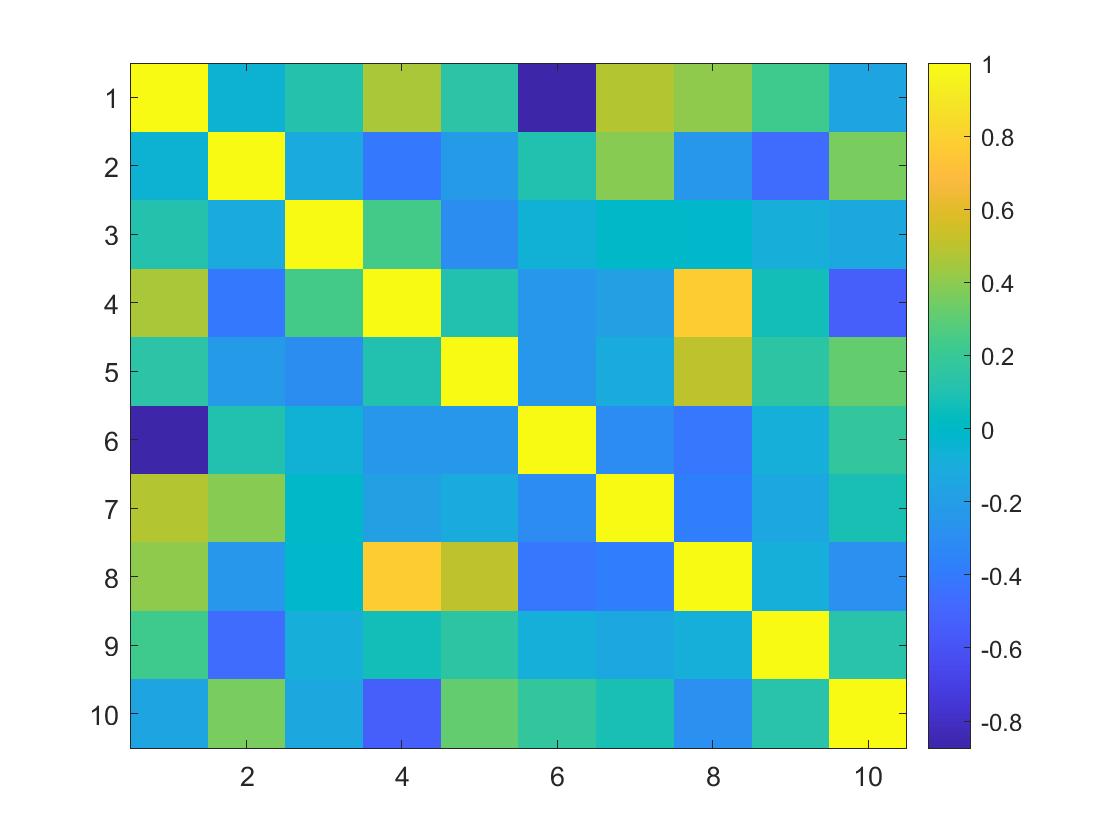
Which code block most likely produced this graph?
figure
x = rand(10,10);
r = corrcoef(x);
surf(r)
colorbar
a = randn(1,1000); histogram(a) ylabel('counts')
figure
x = rand(10,10);
r = corrcoef(x);
imagesc(r)
colorbar
data_nomean = bsxfun(@minus, data, mean(data));