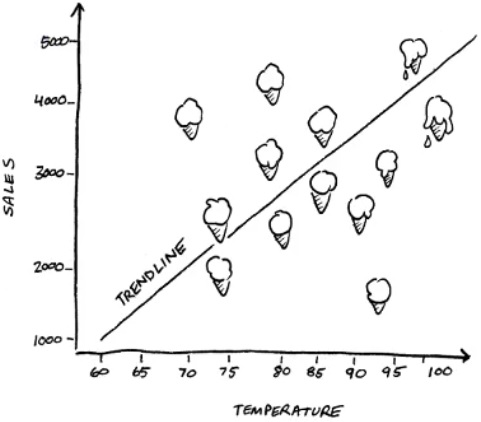
You work for an ice cream shop and created the chart below, which shows the relationship between the outside temperature and ice cream sales. What is the best description of this chart?
You work for an ice cream shop and created the chart below, which shows the relationship between the outside temperature and ice cream sales. What is the best description of this chart?